
Fig. 3.
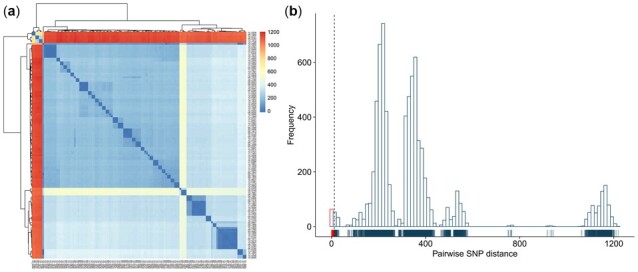
Pan-genome-based pairwise SNP distances between samples. (A) Heatmap representation of the pairwise SNP distances shows genetic similarities and differences among all samples. (B) Histogram represents the distribution of all pairwise SNP distances. The peaks represent the genetic differences between major lineages. The dashed line denotes a cutoff of 12 SNPs. Rug lines representing individual pairs are shown at the bottom