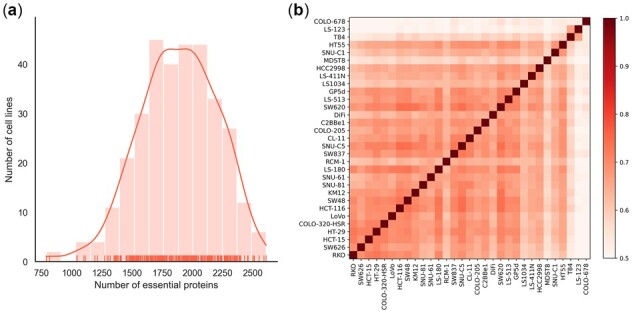
Fig. 2.

Analysis of protein essentiality across different cell lines. (a) Distribution of the numbers of essential proteins across 323 cell lines. (b) Heatmap of pairwise Pearson correlation coefficients for essential protein data across 31 different colorectal carcinoma cell lines. Darker color means the two cell lines have more common essential proteins
