
Fig. 4.
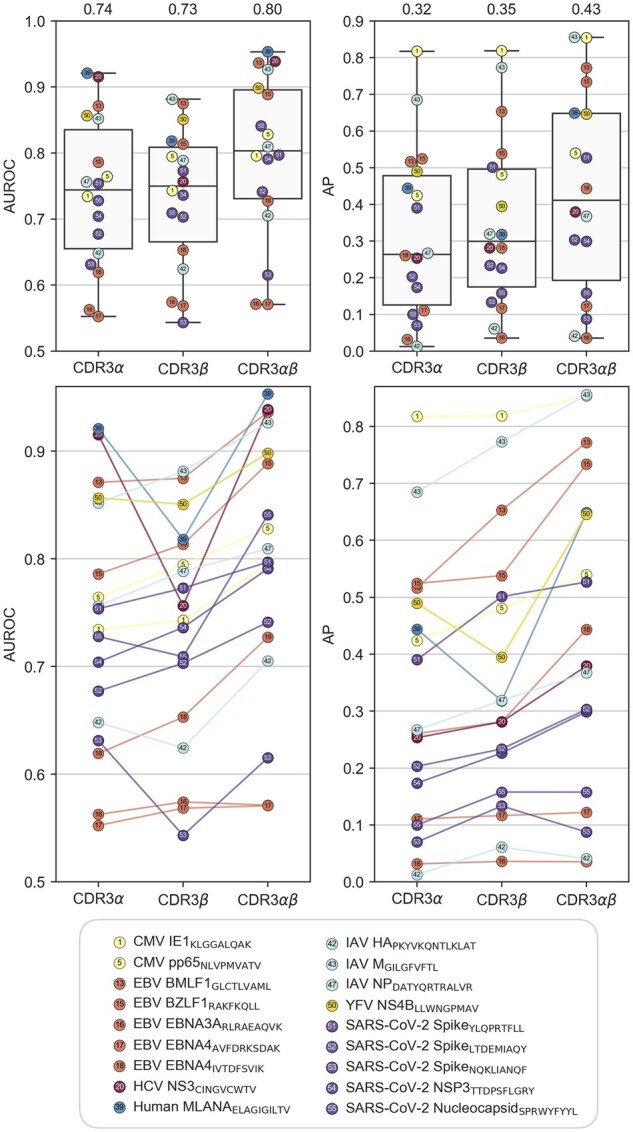
TCRconv performs best when using both α- and β-chains. Results are obtained on VDJdbαβ-large dataset in terms of average AUROC and AP scores over stratified 10-fold cross-validation. Each circle corresponds to TCRs specific to one epitope as described in the legend. Above boxplots show the distribution of the prediction accuracies when the TCRconv model is trained using embeddings for CDR3α, CDR3β or both (always with the full context, meaning that an embedding is first computed for the complete TCR determined by the CDR3, and V- and J-genes, and then the part corresponding to the CDR3 is extracted). Mean metrics are shown on top of each boxplot. Below the circles from the three models are connected by lines, illustrating how for most epitopes the best results are obtained when using both chains and that using β-chains is better than using α-chains, although there are exceptions