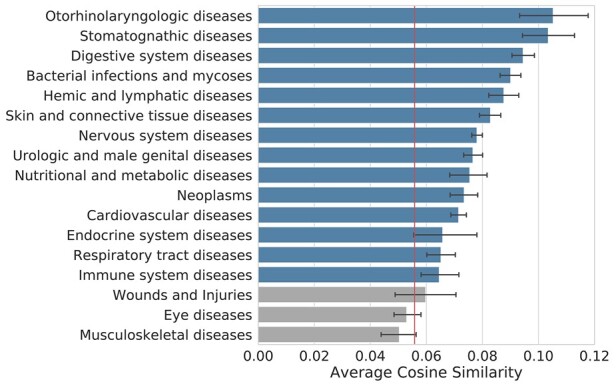
Fig. 7.

The similarity of related protein score vectors between ADR pairs sharing the same MeSH terms. Bar plots show the cosine similarity of all ADR pairs which share a certain MeSH term. The average cosine similarity of ADR pairs that do not share any mesh terms is indicated by a vertical red line as a baseline. The MeSH terms with a significant difference in the average similarity between the baseline are plotted in the blue bar and others are plotted in the gray bar. The error bar indicates the 95% confidence interval of the average
