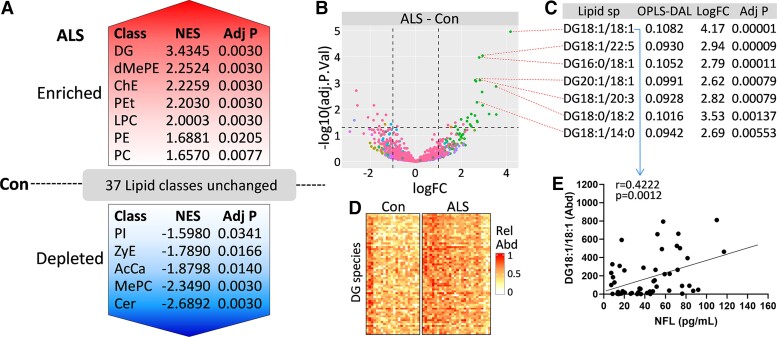
Figure 2.
Lipidomics analysis of ALS serum. (A) LSEA of lipid classes altered in ALS (n = 56) serum compared with controls (n = 44) was performed using the lipidr package for differential expression and discriminant analysis. Lipid expression intensities were normalized with probabilistic quotient normalization and log2 transformed before being analysed for differential expression and significance set at adjusted P < 0.05. The significant lipids were ranked by NES and significance. A volcano plot shows altered lipid species (B) with DG species being the most significantly altered species (C). (D) A heatmap showing DG species in ALS compared with controls. (E) DG (18:1/18:1) species correlated significantly with NFL levels in ALS.

