Figure 5.
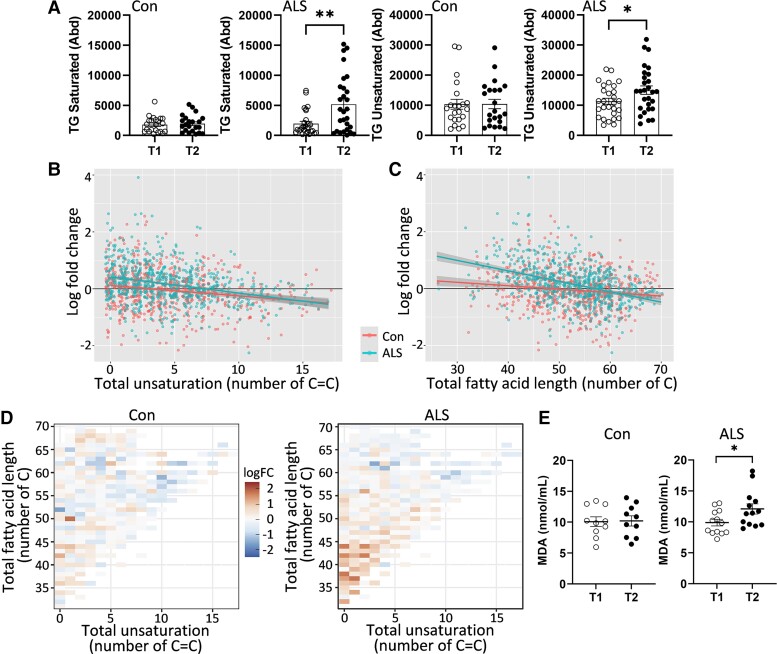
Analysis of lipid unsaturation. (A) Abundance of saturated t-test, *P < 0.05 t = 2.118 and unsaturated t-test, **P < 0.005, t = 3.288 TG in ALS (n = 28) and controls (n = 22). (B) A fold-change plot of individual TG species in terms of total unsaturation. (C) A fold-change plot of individual TG species in terms of total fatty acid length. (D) Heat maps show that changes were more pronounced in TG species with fewer C=C and shorter chain length in ALS. (E) Verification of increased lipid peroxidation product, MDA, with time in ALS (n = 13) t-test, *P < 0.05, t = 2.248 and control (n = 10).

