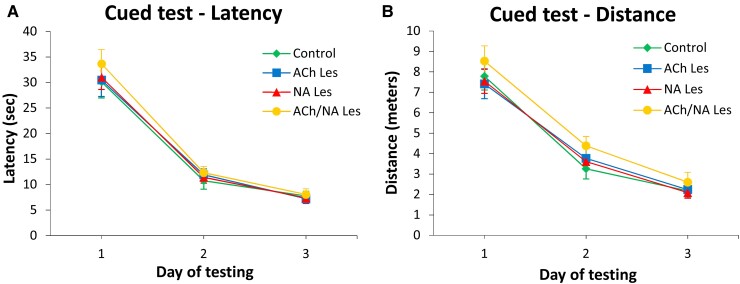
Fig. 1.
Performance in the cued version of the Morris water maze test. In this task, the visually cued platform was moved to a new quadrant on each of the four daily trials, and average escape latencies (A) and swim distances (B) were recorded. In this test, the animals (n = 15 in each group) did not differ from each other (two-way mixed ANOVA main group effect on latency, F(3,56) = 0.35; on distance, F(3,56) = 1.01; all P > 0.05, n.s.). Each point represents the mean value ± SEM for the block of four trials administered each day, over the three training days

