Figure 2.
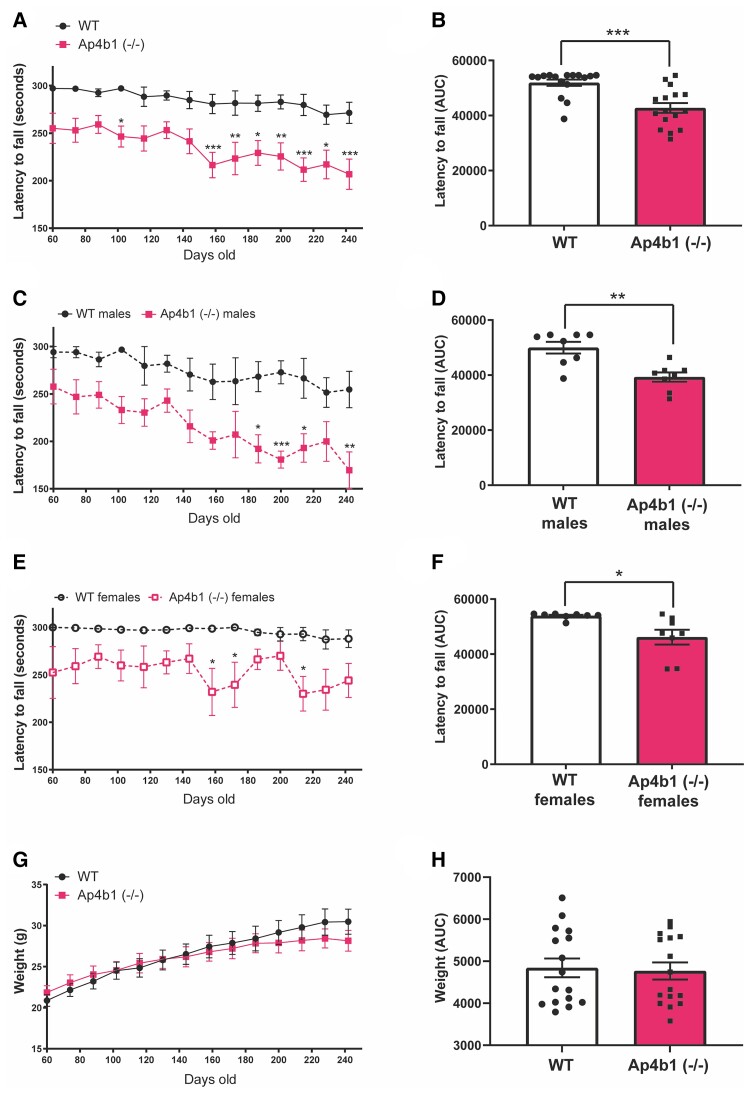
Ap4b1 (−/−) mouse model of SPG47 displays progressive reduction in motor performance compared with WT mice. Mice were assessed at several timepoints by accelerating rotarod, with their performance shown as the latency to fall in seconds against age in days (A). The area under the curve (AUC) for rotarod performance was calculated and analysed by Student’s two-tailed t-test (B). Data shown separately for male (C and D) and female mice (E and F). Total body weight in grams over time was also recorded (G). AUC analysis of body weight (H). Data are presented as the mean ± S.E.M. Combined sex data n = 16 animals per group. Split by sex data n = 8 per group. A, C, E and G are analysed by two-way repeated measures ANOVA with Bonferroni post hoc test. B, D and F analysed by Student’s two-tailed t-test. *P < 0.05, **P ≤ 0.01, ***P ≤ 0.001, ****P ≤ 0.0001.

