
Figure 2. Representative transmission electron microscopy images.
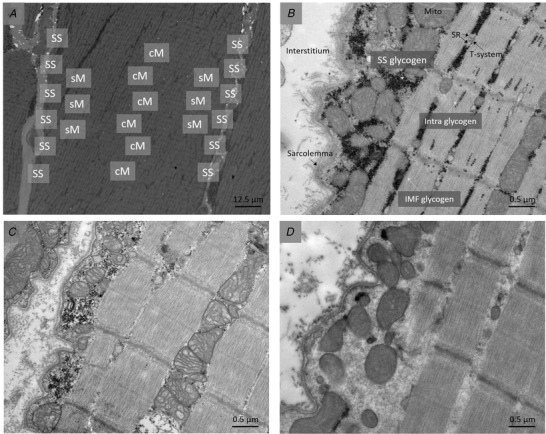
(A) Overview of micrograph sampling areas obtained at a magnification of x550, (B) an subsarcolemmal sampling area at baseline, (C) post‐exercise period 1 and (D) post‐exercise period 3, all obtained at x13,500 magnification. In D, note the almost complete lack of glycogen granules. All images are from type 2 fibres (fibre typed based on Z‐disc width) from the same participant. The black dots are glycogen particles. cM, central myofibrillar; IMF, intermyofibrillar; Intra, intramyofibrillar; Mito, mitochondria; sM, superficial myofibrillar; SR, sarcoplasmic reticulum; SS, subsarcolemmal.