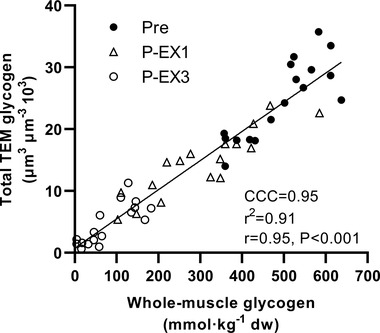
Figure 4. Relationship between muscle glycogen determined biochemically (whole‐muscle) and by transmission electron microscopy (TEM).

Data represents muscle biopsies obtained pre‐exercise (Pre), after exercise period 1 (P‐EX1) and after exercise period 3 (P‐EX3) during repeated high‐intensity intermittent exercise. Each data point represents muscle glycogen determined biochemically from each biopsy and TEM total muscle glycogen per biopsy determined as an average of all three type 1 and three type 2 fibres from each sample. CCC, Lin's concordance correlation coefficient.
