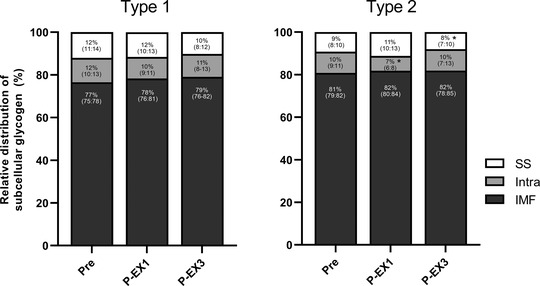
Figure 5. Relative distribution of subcellular muscle glycogen content in type 1 and type 2 fibres during repeated high‐intensity intermittent exercise.

Data represents subsarcolemmal (SS), intramyofibrillar (Intra) and intermyofibrillar (IMF) glycogen determined pre‐exercise (Pre) and after exercise period 1 (P‐EX1) and 3 (P‐EX3). n = 17. Data are presented as means and 95% CI. *Significant effect of time within fibre type, P ≤ 0.05.
