
Figure 7. Single‐fibre subcellular glycogen heterogeneity in relation to whole‐muscle glycogen content.
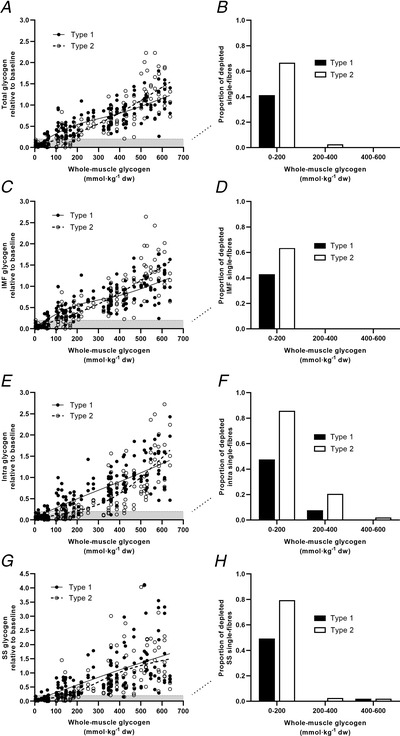
A, C, E and G, transmission electron microscopy determined single‐fibre subcellular glycogen in type 1 and type 2 fibres plotted relative to the whole‐muscle glycogen concentrations determined biochemically. (A) Total single‐fibre glycogen based on all subcellular pools, (C) intermyofibrillar glycogen (IMF), (E) intramyofibrillar glycogen (Intra) and (G) subsarcolemmal glycogen (SS) in type 1 and 2 single fibres expressed relative to the baseline geometric mean of all fibres in each pool (1 = baseline geometric mean). B, D, F and H, proportion of type 1 and 2 single fibres in each glycogen fraction depleted below 20% of the baseline level grouped at different whole‐muscle glycogen concentrations for (B) total single‐fibre glycogen based on all subcellular pools, (D) IMF glycogen, (F) Intra glycogen and (H) SS glycogen. n = 3 type 1 and 3 type 2 fibres from each of n = 17 participants. Data are presented as individual values and best fit lines (type 1 fibres, continuous line; type 2 fibres, dashed line). The grey‐shaded area below the dashed line denotes the depleted or near‐depleted level of <20% of baseline geometric mean for reference.