
FIGURE 1.
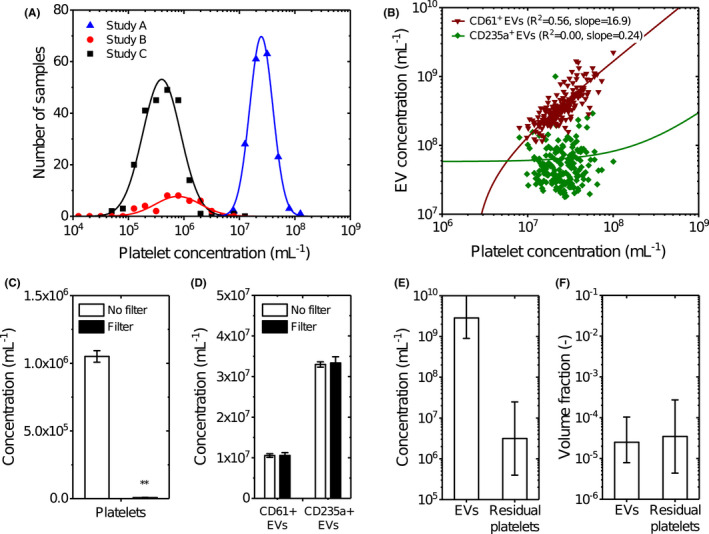
(A) Distribution of the platelet concentration in blood plasma from three independent studies measured by flow cytometry. Although all samples were double centrifuged at 2500 g for 15 min at 20°C using the fastest acceleration and lowest deceleration setting, 17 each study resulted in different distributions of the platelet concentration. In study A, blood was collected from healthy volunteers (n = 21) and patients with myocardial infarction (n = 160) and anticoagulated with citrate, and platelets were measured after a freeze–thaw cycle in plasma. In study B, blood was collected from healthy volunteers and anticoagulated with citrate (n = 10), spray‐dried K2‐EDTA (n = 10), gel plug K2‐EDTA (n = 10), and ACD‐A (n = 10), and platelets were measured after a freeze–thaw cycle in plasma. In study C, blood was collected from healthy volunteers (n = 221) and anticoagulated with EDTA, and platelets were measured in fresh plasma. Data were log transformed, binned using a bin size of 0.2, and transformed back to a linear scale. Data (symbols) have been fitted in logarithmic space with a Gaussian function (lines), resulting in fit parameters μ = 7.39, σ = 0.21, and A = 36.50 for study A; μ = 5.89, σ = 0.41, and A = 7.87 for study B; and μ = 5.60, σ = 0.34, and A = 45.45 for study C. (B) Concentration of CD61+ (triangles) and CD235a + (squares) extracellular vesicles (EVs) versus the platelet concentration in plasma of donors from study A measured by flow cytometry. Data have been fitted in with a linear function (lines), resulting in a slope of 16.9 and an intercept of −3.9 × 10⁷ for CD61+ EVs and a slope of 0.24 and an intercept of 5.8 × 10⁷ for CD235a + EVs. CD61+ EVs show a strong (R 2 = .56) and CD235a + EVs show no correlation (R 2 = .00) with the platelet concentration. Due to the log–log data representation and linear functions with an offset, the fits appear non‐linear. (C) Concentration of platelets in plasma (n = 3) after double centrifugation (open) and after double centrifugation followed by filtration with a polycarbonate filter with pore diameters of 0.8 μm (filled) measured by flow cytometry. Data are presented as the mean ± standard deviation. Double centrifugation followed by filtration with a polycarbonate filter is 146‐fold more effective in removing platelets compared to only double centrifugation (p = .0013, **). (D) Concentration of platelet‐derived (CD61+) EVs, and erythrocyte‐derived CD235a + EVs in plasma (n = 3) after double centrifugation (open) and after double centrifugation followed by filtration with a polycarbonate filter with pore diameters of 0.8 μm (filled) measured by flow cytometry. Data are presented as the mean ± standard deviation. EVs exceeding the side scatter threshold (≥10 nm2), with a diameter >200 nm, that were positively labeled with a platelet marker (CD61) and an erythrocyte marker (CD235a) were included. Double centrifugation followed by filtration with a polycarbonate does not affect the concentration of CD61+ EVs (p = .982) and CD235a + EVs (p = .742) compared to only double centrifugation. (E, F) Estimated guess of the total concentration and volume fraction of EVs and platelets in plasma. Although EVs outnumber the platelets probably with three orders of magnitude, their volume fractions in plasma are comparable. The estimated guess of the total EV concentration in plasma is based on consensus within the EV flow cytometry working group. The error bars of the platelet concentrations represent the mean concentrations of study A and C measured in panel A. Calculations of the volume fractions are explained in the Section 2.