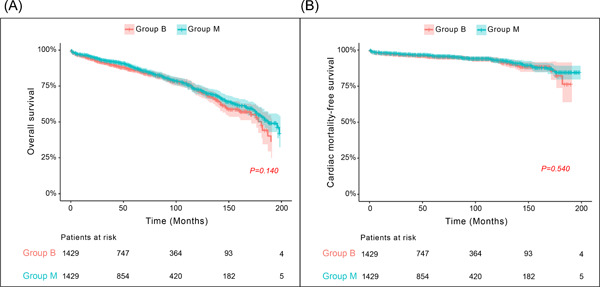
Figure 3.

Comparison of (A) overall survival and (B) cardiac mortality‐free survival between the matched Groups B and M. All p values were obtained using stratified log‐rank tests. Group B, patients who underwent AVR with biological prosthesis; Group M, patients who underwent AVR with mechanical prosthesis. AVR, aortic valve replacement
