Figure 6.
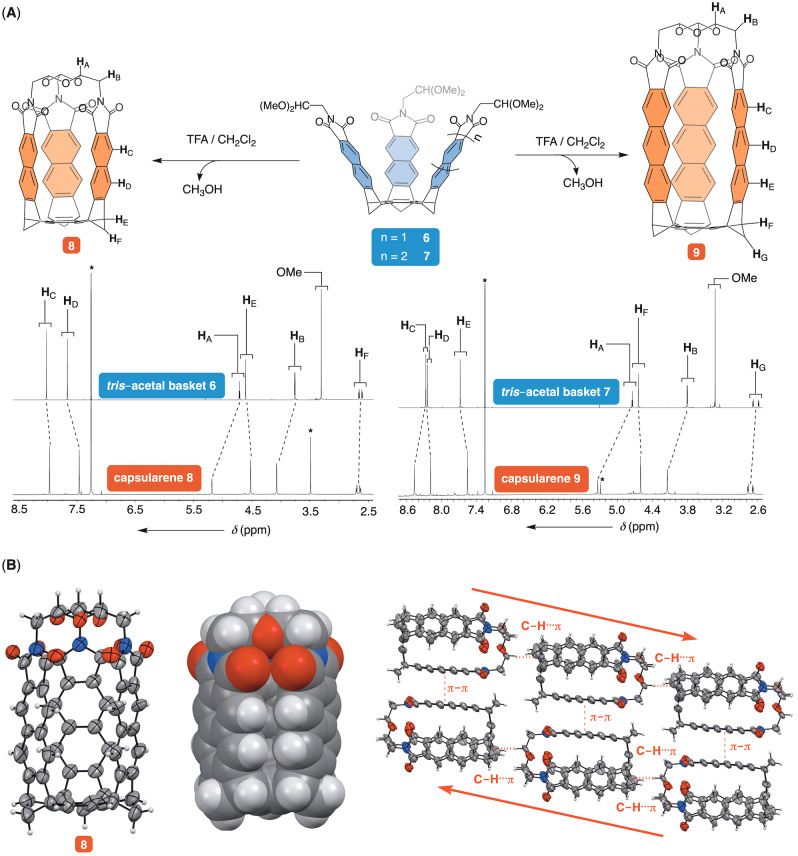
A) Capsularenes 8 and 9 were obtained from tris‐acetal baskets 6 and 7, respectively. 1H NMR spectra (850 MHz, 298 K) of 6–9 in CDCl3 are shown at the bottom; note that CDCl3 solution of capsularenes 9 contains TFA (for improving its solubility). B) ORTEP plot (50 % probability) and CPK representation of capsularene 8 obtained from MicroED analysis. (Right) Capsularenes 8 form 1D arrays along crystallographic b axis.

