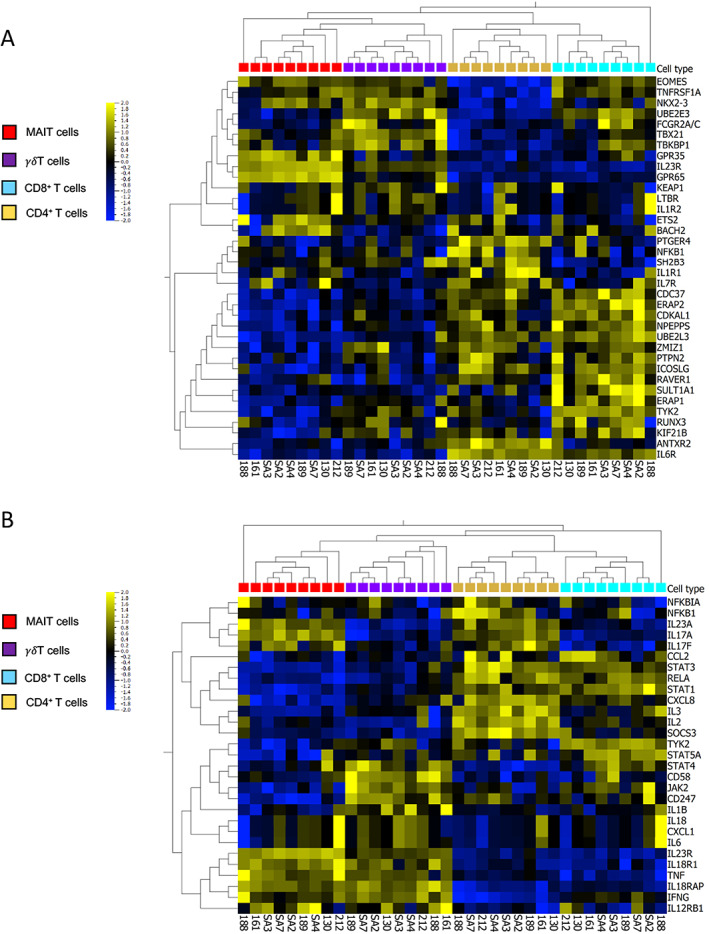
Figure 1.

Heatmaps showing the expression patterns of genes associated with ankylosing spondylitis (AS) and of genes of the interleukin‐23 (IL‐23)/IL‐17 pathway in T cell subpopulations isolated from the peripheral blood of patients with axial spondyloarthritis (SpA). A, Expression levels of 36 genes associated with AS susceptibility in T cells from axial SpA patients. B, Messenger RNA expression levels of 29 genes associated with the IL‐23/IL‐17 pathway, selected from the Molecular Signatures Database. T cells were stimulated for 2 hours with phorbol myristate acetate (50 ng/ml), calcium ionophore A23187 (5 μM), and β‐1,3‐glucan (50 μg/ml). Heatmaps show hierarchical clustering of genes among T cell populations from individual patient samples (n = 9). Gene expression data are log2 transformed, centered to a mean value of 0, and scaled to unit variance. The color key on the left denotes the scale of gene expression, ranging from lower levels (blue) to higher levels (yellow).
