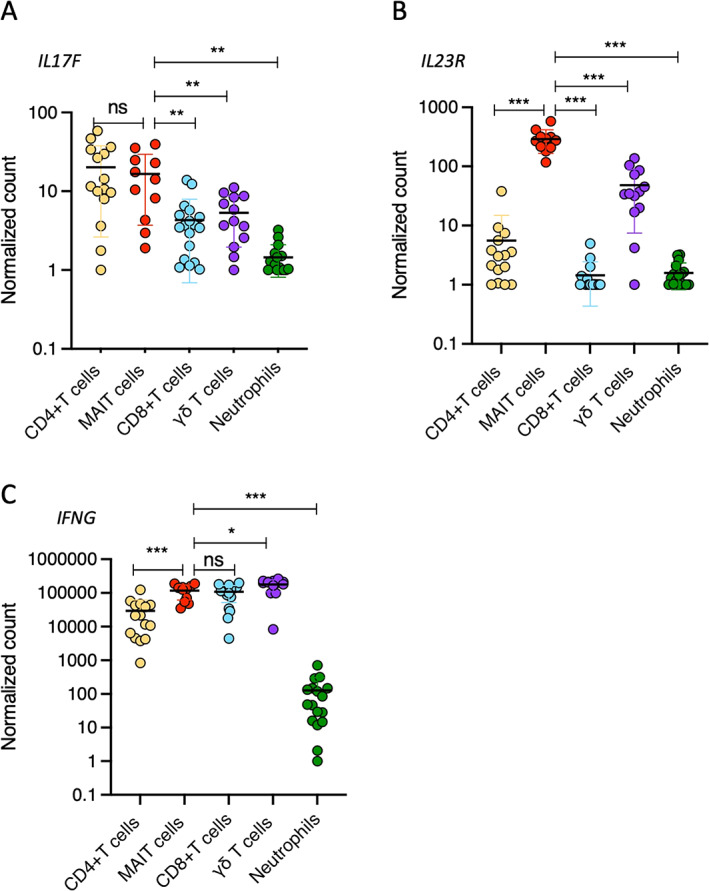
Figure 3.

Sorted CD4+ T cells, MAIT cells, CD8+ T cells, γδ T cells, and neutrophils from the peripheral blood of axial SpA patients were analyzed for gene expression of IL17F (A), IL23R (B), and IFNG (C). Results are presented as normalized transcript levels. Cells were stimulated with phorbol myristate acetate (50 ng/ml), calcium ionophore A23187 (5 μM), and β‐1,3‐glucan (50 μg/ml). Symbols represent individual samples. Bars show the mean ± SEM. * = P < 0.05; ** = P < 0.01; *** = P < 0.001, by Wilxocon‐Mann‐Whitney test. See Figure 2 for definitions.
