Figure 4.

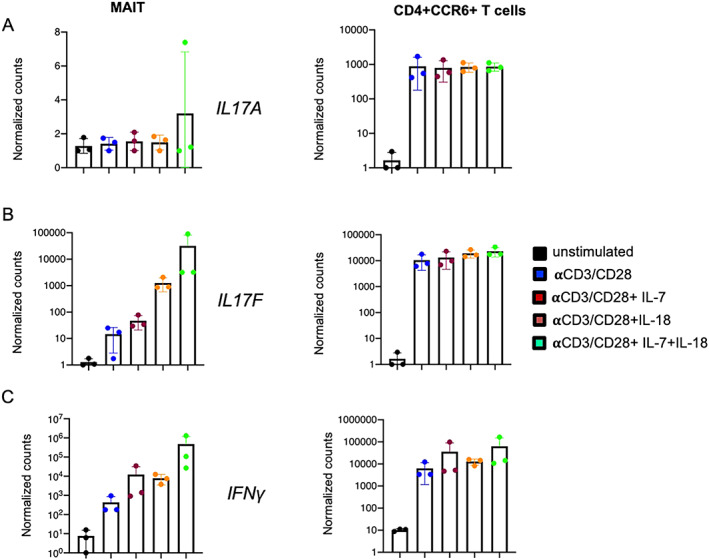
Gene expression of IL17A (A), IL17F (B), and IFNG (C) in sorted mucosal‐associated invariant T (MAIT) cells and CD4+CCR6+ T cells from non‐axial SpA patients (n = 3) after 36 hours of stimulation in 6 different conditions, including unstimulated, stimulation with anti‐CD3/anti‐CD28, stimulation with anti‐CD3/anti‐CD28 and interleukin‐7 (IL‐7) (20 ng/ml), stimulation with anti‐CD3/anti‐CD28 and IL‐18 (50 ng/ml), and stimulation with anti‐CD3/anti‐CD28 and both IL‐7 (20 ng/ml) and IL‐18 (50 ng/ml). Results are presented as the mean ± SEM normalized transcript levels. Symbols represent individual samples.
