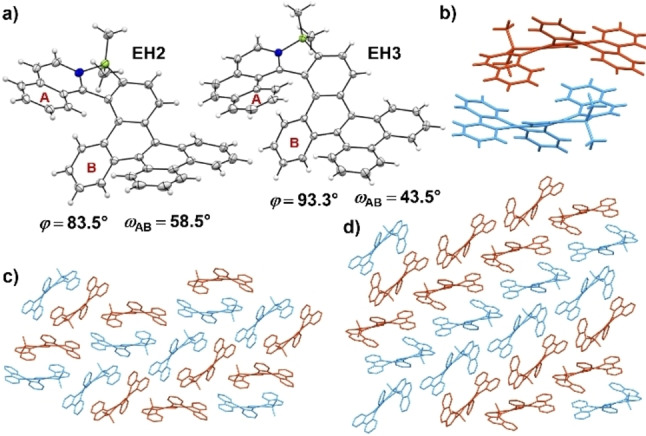
Figure 2.

a) Molecular structures of EH2 and EH3 determined by X‐ray analysis at 100 K. Only (P)‐enantiomers are depicted. ORTEP drawings are shown with 50 % probability. b) An (M)‐ and (P)‐dimer of EH2. Packing arrangements of c) EH2 and d) EH3. Hydrogen atoms are omitted for clarity. (P)‐ and (M)‐enantiomers are colored in blue and maroon, respectively.
