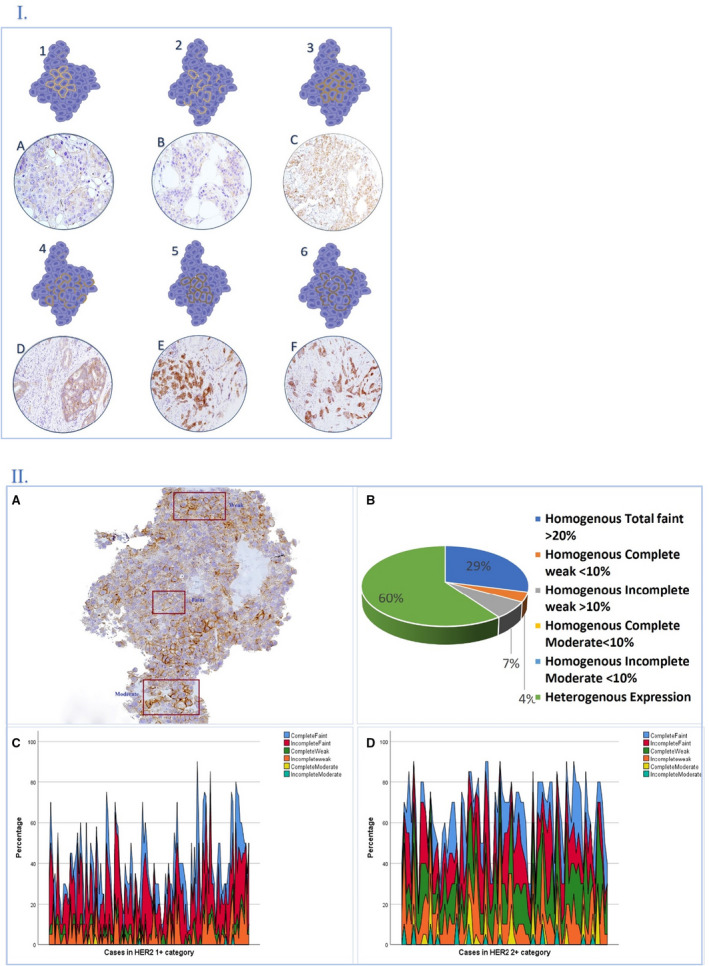
Figure 3.

1, An illustrated diagram and photomicrographs showing different human epidermal growth factor receptor 2 (HER2) membranous staining patterns and intensities. Faint complete (1A); faint incomplete (2B); weak complete (3C); weak incomplete (4D); moderate complete (5E), moderate incomplete (6F). 2, Graphical description highlighting degree of intratumoral heterogeneity HER2) low category. 2A, HER2 immunohistochemistry (IHC)‐stained slide showing different staining intensities within the same tumour; 2B, pie chart showing that 60% of HER2 1+ cases were scored based on heterogenous mixed expression patterns, while only 40% were scored based on single homogenous staining. Moderate staining was present in addition to other staining patterns and not in the HER2 1+ category alone. Sparkline graphs show multiple combinations of heterogenous patterns in example of HER2 score 1+ (2C), and another example of HER2 score 2+ (2D).
