FIGURE 2.

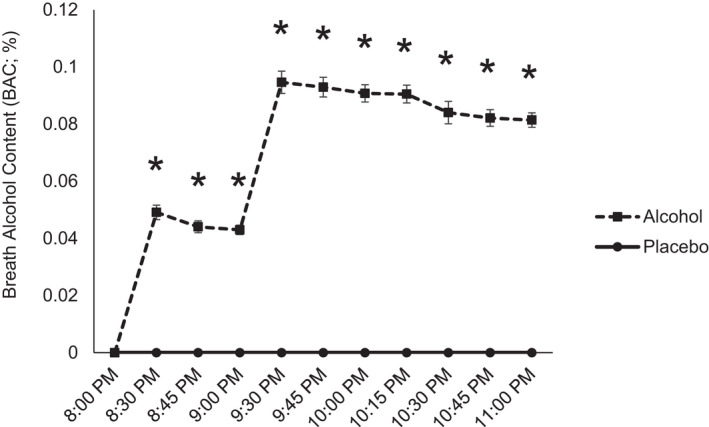
Mean (±SEM) Breath Alcohol Content (mg/L) after consumption of placebo (solid line, circle) and alcohol (dashed line, diamond) during the session and the following morning. * paired t‐test p > 0.05.

Mean (±SEM) Breath Alcohol Content (mg/L) after consumption of placebo (solid line, circle) and alcohol (dashed line, diamond) during the session and the following morning. * paired t‐test p > 0.05.