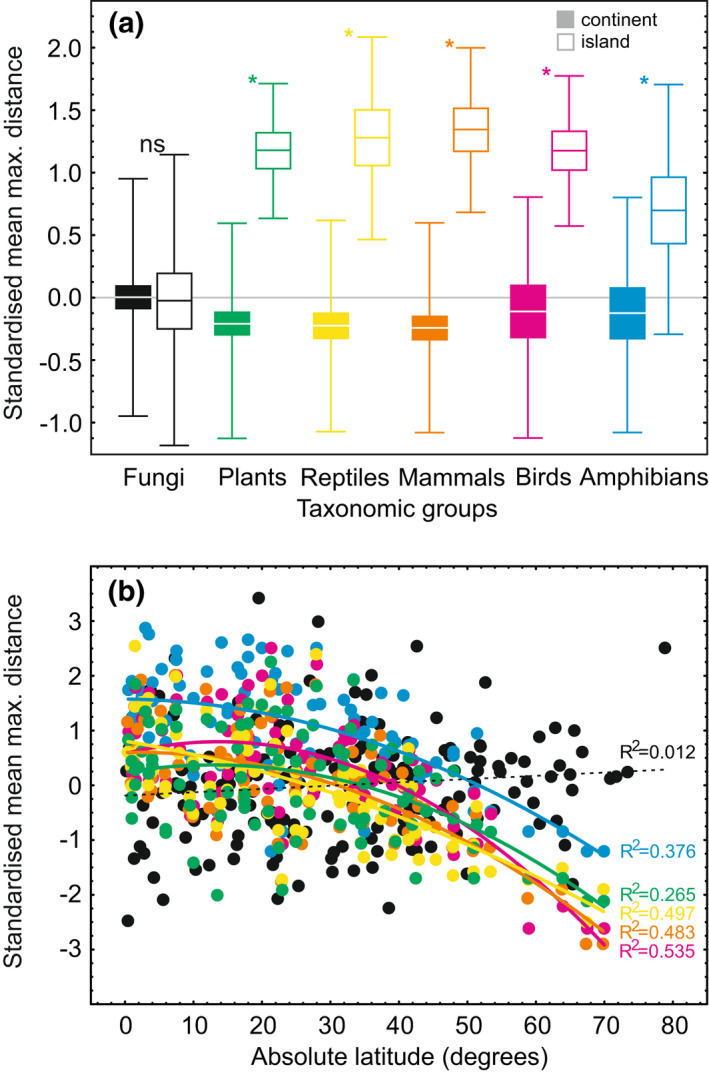
FIGURE 4.

Endemicity patterns of fungi compared with plants and various vertebrate groups: (a) insularity effect and (b) latitudinal distribution. The analyses are based on world's ecoregions that differ for fungi compared with plants and animals (Kier et al., 2009). For all data sets, the mean maximum distance of all species was available and therefore taken as a measure of relative endemicity. For comparative purposes, these values were logarithm‐transformed, corrected for sequencing and sampling depth (only fungi) and z‐transformed. In (a) lines, boxes and error bars represent mean, SE and SD, respectively. In (b) the endemicity values were regressed against latitude using second‐order polynomial function; colours represent different organism groups as indicated in (a). For fungi, n = 156 and n = 28 for continent and island ecoregions, respectively; for other groups, n = 76 and n = 14 for continent and island ecoregions, respectively.
