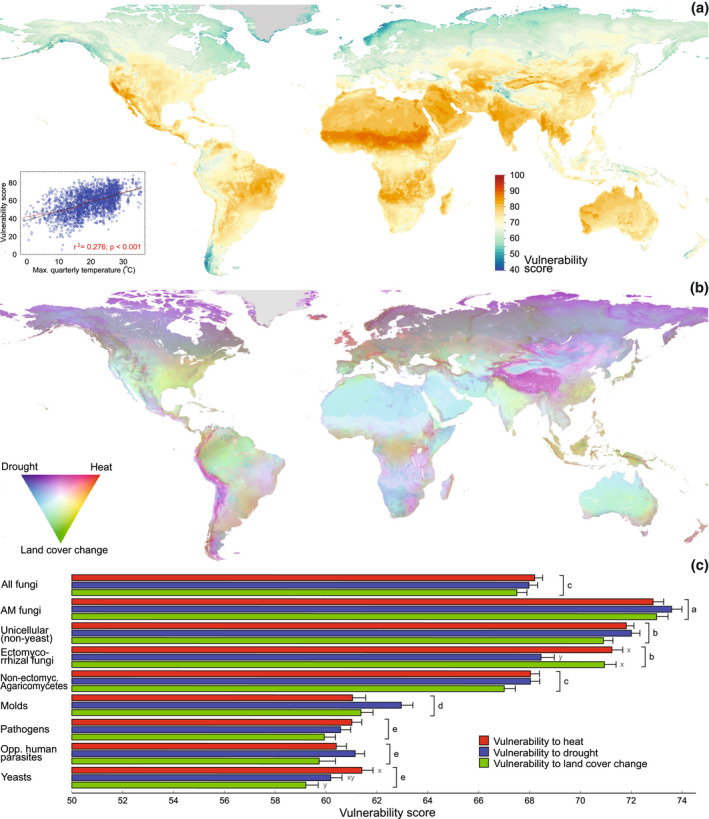
FIGURE 5.

Vulnerability of fungi to global change drivers: (a) average vulnerability of all fungi to drought, heat and land cover change. The inset shows the near‐linear relationship of vulnerability to the air temperature of the warmest quarter. (b) Relative importance of predicted vulnerability of all fungi to drought, heat and land cover change as indicated by colour mixes. For example, the purple colour indicates high vulnerability to both heat and drought but low vulnerability to land cover change. (c) Relative importance of global change drivers for the predicted vulnerability of soil fungi and functional groups. Different letters indicate statistically significant (p < .001) differences among functional groups (a–e) and among global change drivers within functional groups (x–z). Mapping error estimates for panel (a) are given in Figure S4.
