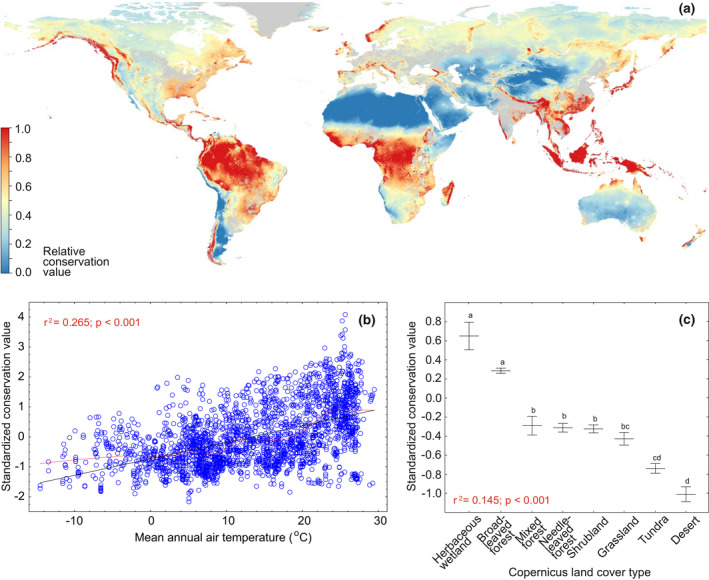
FIGURE 6.

Conservation priority areas for all fungi (a) and their relationships with mean annual temperature (b) and Copernicus land cover types (c). In (b), black and red lines indicate best‐fitting linear and lowess functions, respectively. In (c), central lines and whiskers indicate mean and standard errors, respectively; letters above whiskers indicate statistically significant differences among land cover types.
