
FIGURE 1.
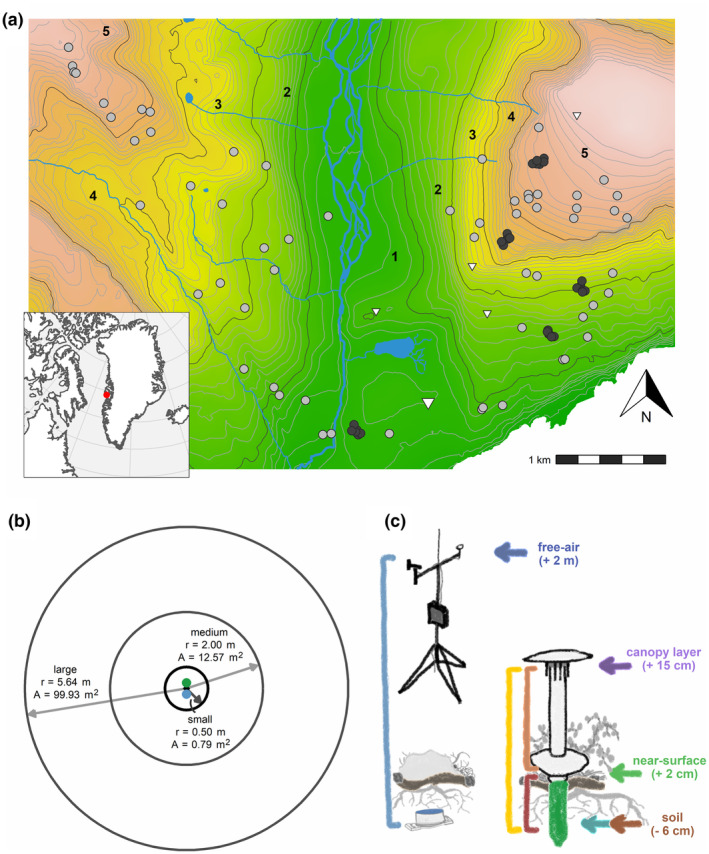
The locations and design of the microclimate monitoring. (a) We placed 90 plots across an arctic tundra landscape at Qeqertarsuaq (Disko Island), Western Greenland. We placed sample plots according to a stratified random design to capture variation in vegetation productivity, water availability, and elevation (dots). Sample plots within core areas are shown as black dots. Positions of weather stations are shown as triangles, and the enlarged triangle marks the lowest elevation station that was used as a free‐air temperature reference variable in our microclimate models. Background color indicates elevation (green low, brown/white high) and contour lines intervals of 20 m. The five elevation zones are delimited with black lines. (b) At each sample plot, we placed a TOMST TMS‐4 logger (green dot) 10 cm north and a HOBO logger (blue dot) 10 cm south of the plot center. We monitored vegetation cover in three nested circles of different areas around the center (main analysis using data from small circles). (c) Local and microclimate were monitored with different sensors: TMS loggers measured temperature at three heights as well as soil moisture (Wild et al., 2019) across the growing season, HOBO loggers measured soil temperature during a complete year, and weather stations provided local air temperature. Vertical bars indicate sensor pairs for calculation of temperature differences. Note that plot locations (e.g., core area at elevation band 3) may fall into different elevation bands due to local topographic or substrate conditions (see text for details). Circles and loggers are not to scale.