
FIGURE 3.
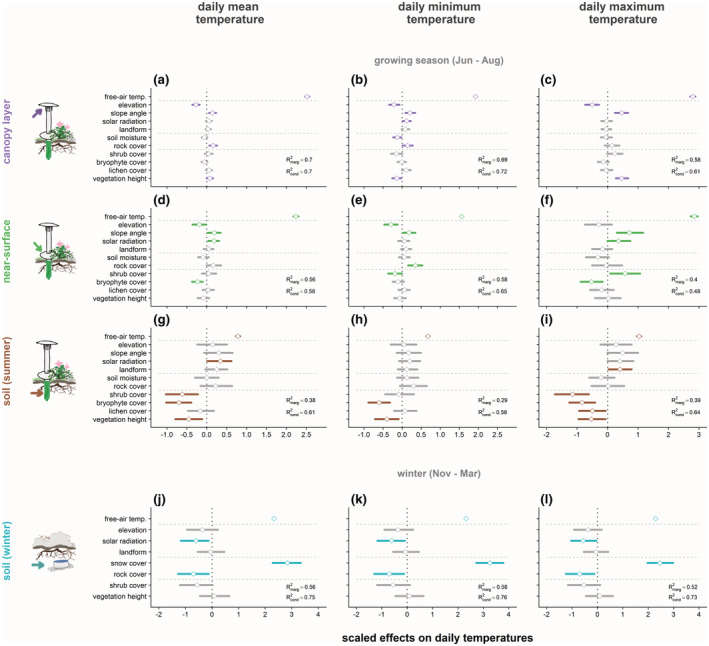
Tundra vegetation and snow cover duration were strong predictors of soil temperatures in particular, during the growing season and winter. Temperatures represent seasonal averages of daily mean, minimum, and maximum temperatures for (a–c) free‐air, (d–f) near‐surface, and (g–i) soil layers during the growing season, as well as for (j–l) soil during winter (November 2019 through March 2020). Points and horizontal segments represent means and 95% credible intervals for scaled effect sizes of plot‐scale topography and vegetation variables across small sample plots (radius 0.5 m). See Table S6 for predicted effect sizes for all models and variables.