
FIGURE 4.
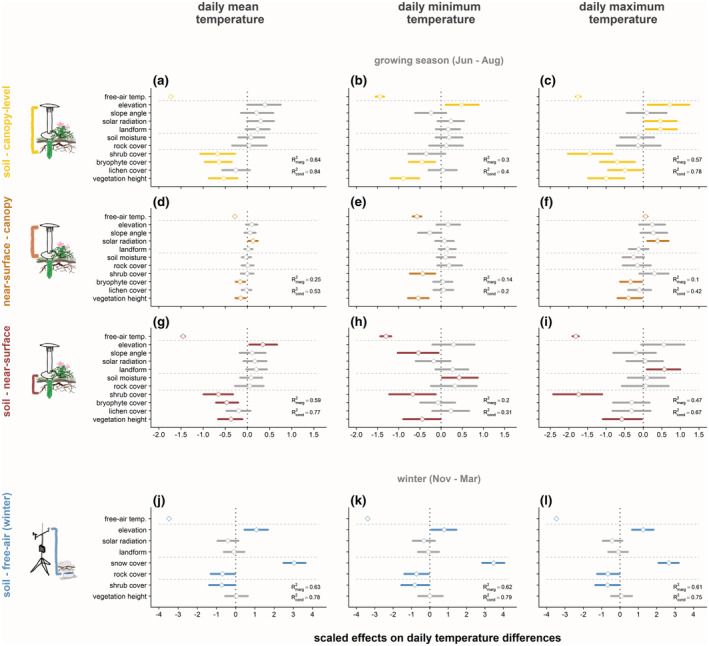
Vegetation predicted differences of soil temperatures relative to above‐ground temperatures better than local topography during the growing season, while snow cover duration was the strongest predictor during winter. Temperature differences were calculated between daily mean, minimum, and maximum temperatures for (a–c) canopy‐level versus soil, (d–f) canopy‐level versus near‐surface, and (g–i) near‐surface versus soil layers during the growing season of 2019, and for (j–l) free‐air versus soil layers during winter (November 2019 through March 2020). Points and horizontal segments represent means and 95% credible intervals for scaled effect sizes of plot‐scale topography and vegetation variables across small sample plots (radius 0.5 m). See Table S6 for predicted effect sizes for all models and variables, and Figure S5 for models of canopy versus free‐air and soil versus free‐air ΔT.