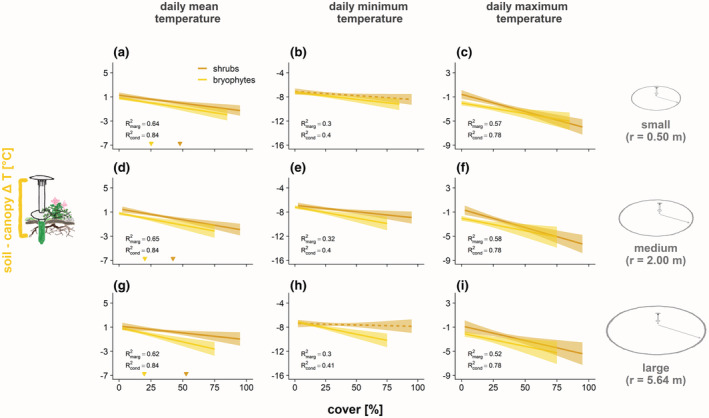
FIGURE 5.

Growing season temperature differences between canopy level and soil shift from warmer to cooler soils with higher shrub and bryophyte cover. The relationships were consistent across plot sizes, as vegetation cover measures were highly correlated across plot sizes (Table S7). Predicted relationships of bryophyte and shrub cover on canopy versus soil differences in mean as well as average daily minimum and maximum temperatures over the 2019 growing season, compared across different plot sizes of (a–c) 0.5 m, (d–f) 2 m, and (g–i) 5.64 m radius. Dashed lines indicate nonsignificant relationships. Arrows indicate predicted cover values at which ΔT's shift from warmer to cooler soils. Vertical axis ranges are aligned to make slopes comparable. Data points were removed to improve readability (presented in Figure S6). See also Table S7 for predicted zero‐difference thresholds for mean temperatures, and Figure S7 for corresponding predictions from vegetation height. Note that loggers and circle sizes on the right are not to scale.
