
FIGURE 6.
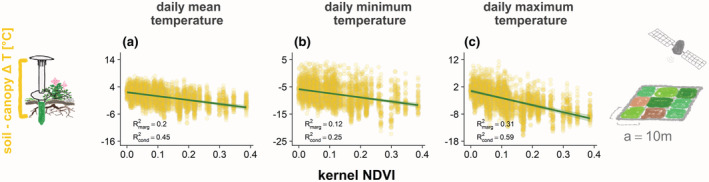
Remotely sensed vegetation productivity reliably predicted below‐ versus above‐ground ΔT, but explained too little variation for reliable extrapolation. Predicted linear relationships of kernel NDVI (Camps‐Valls et al., 2021) with canopy versus soil differences in daily (a) mean, (b) minimum, and (c) maximum temperatures over the 2019 growing season. We extracted kNDVI for large plots (100 m2; Figure 1b) from 10‐m resolution Sentinel‐2 imagery from July 29, 2019. Vertical axis ranges are aligned to make slopes comparable.