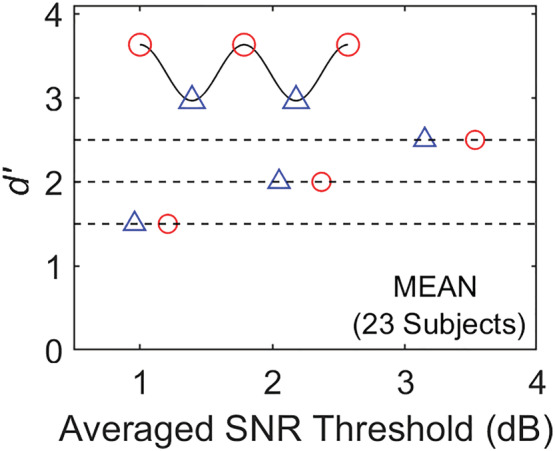
FIGURE 6.

SNR thresholds at 3 d′ levels calculated from psychometric functions averaged across 23 subjects from Sun et al. (2021) for each of two ‘phase categories’ (peak‐phase = red; trough = blue). Note that the peak‐phase category requires a higher SNR threshold to reach a performance level (d′) equivalent to that for the trough category (envelope minima). Legend is shown in upper left (sinusoid).
