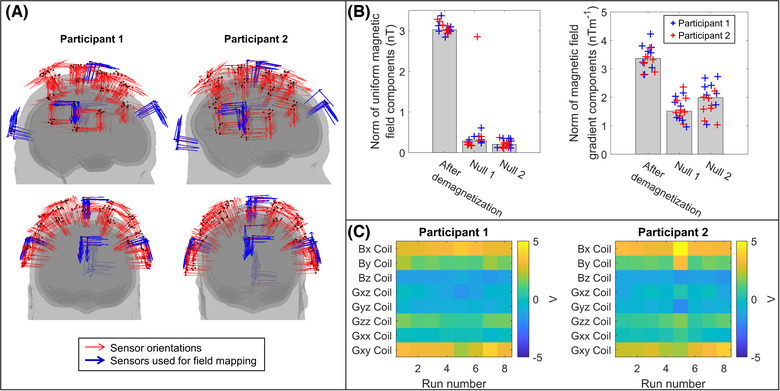
FIGURE 2.

Background magnetic field control. (A) Sensor locations, registered to brain anatomy, for each run. Note: Although the helmet was in a slightly different position on the head in each experiment, the sensor positions and orientations are reasonably consistent. The five sensors used in the nulling procedure are shown in blue. (B) The norm of the three uniform magnetic field components, as determined by the model, is shown on the left. Values immediately following demagnetization and after two iterations of nulling are shown. Bars represent the median value across all 16 scans, while the individual data points are shown as blue crosses for participant 1 and red for participant 2. The norm of the five linear magnetic field gradient components is shown on the right. (C) Matrices showing the consistency of the final voltages applied to each of the coils across the eight scans for each participant.
