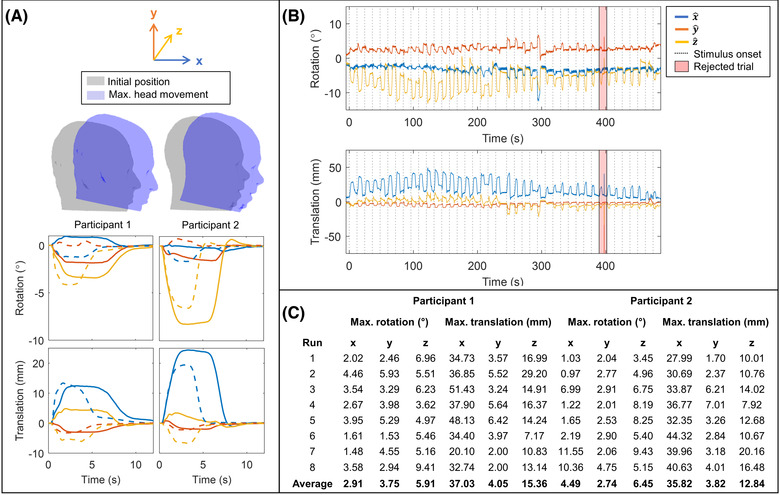
FIGURE 3.

Participant movement during handwriting task. (A) Upper: Visualization of the maximum head rotation about z and maximum translation in x for each participant. Their maximum movement is shown in blue, overlaid on the initial position shown in gray. Lower: Trial‐averaged rotation (top row) and translation (bottom row), in x‐ (blue), y‐ (orange), and z‐directions (yellow). Average movement for left‐handed writing is given by solid lines, and right‐handed writing is shown by dashed lines. On average, participant 2 (right) moved their head more during the task than participant 1 (left). (B) Example time course showing head rotation (upper) and translation (lower) over the course of a scan. The beginning of each trial is marked by a dashed line. The red shaded region indicates a “bad trial,” where an artifact is present due to inaccuracy of the optical tracking. (C) Table of maximum rotation and translation values for both participants across all runs.
