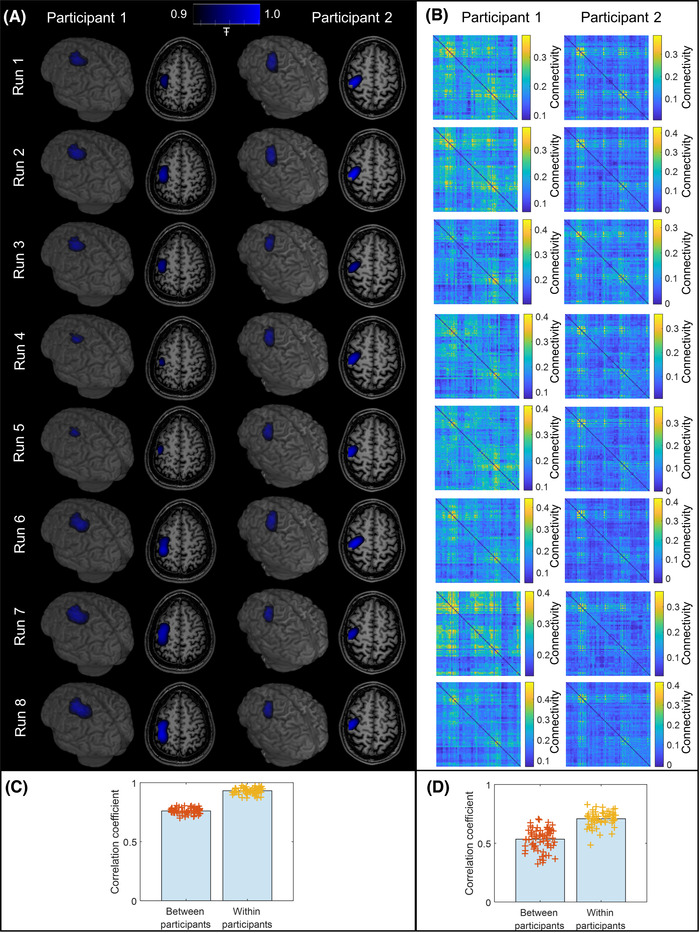
FIGURE 6.

Neural fingerprinting. (A) Pseudo‐T‐statistical images for right‐handed writing in both participants were derived independently for all eight runs of the paradigm and overlaid on their brain anatomy. (B) Connectome matrices for right‐handed writing, again, were derived independently for all eight runs of the paradigm. (C) Fingerprinting analysis for the pseudo‐T‐statistical images given in (A), showing within‐ and between‐participant correlations. The bars indicate the mean correlation value, and the crosses show the individual data points. (D) Equivalent to (C) for the connectome matrices shown in (B). Differences are significant in both (C) and (D) according to our Monte Carlo‐based statistical test.
