
Figure 2. Energetic variables plotted against afterload and preload.
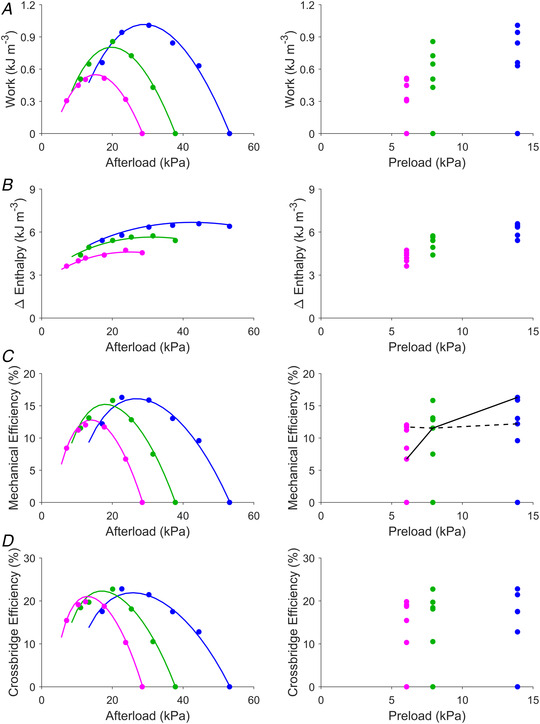
Data are from the same representative trabecula as in Fig. 1A and B ; the same colour coding applies to denote the work‐loop end‐systolic points at the three initial lengths: L/L o of 1 (blue), 0.95 (green) and 0.90 (magenta). Work (the area of the work‐loop) (A), change of enthalpy (the sum of work and heat) (B), mechanical efficiency (the ratio of work to enthalpy change) (C), and crossbridge efficiency (the ratio of work to crossbridge enthalpy change) (D) are plotted as functions of afterload (left panels) and preload (right panels). In the left‐hand panels, the coloured lines were computed using the preloaded work‐loop end‐systolic relations at each of the three initial lengths and superimposed on the plots. On the right‐hand side of panel C, lines are drawn to illustrate the independence (broken line) and the positive dependence (continuous line) of mechanical efficiency on preload. This demonstrates that the efficiency–preload relation is contingent on the selection of afterload.