
Figure 8. Simulated work‐loops with increasing preloads but decreasing relative afterloads (Case 6).
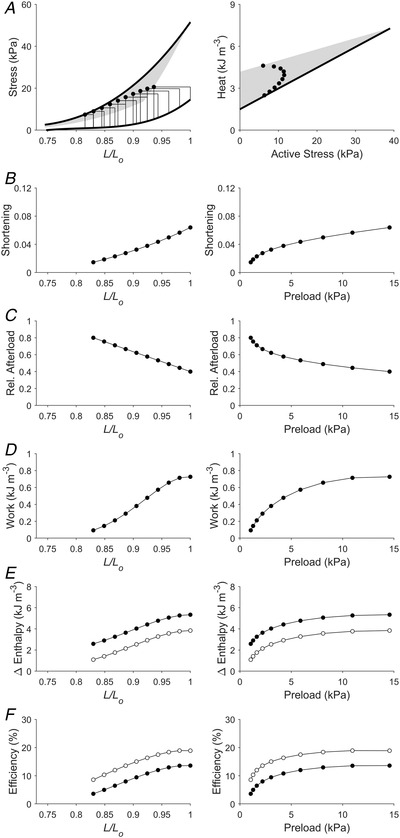
Plotting convention is the same as in Fig. 3. Presented here is a scenario that replicates work‐loops with increasing preloads but decreasing relative afterloads. This scenario is different from that in Fig. 7 because the relative afterload here is decreasing linearly with initial length (panel C), which is brought about by the end‐systolic stress (absolute afterload) increasing monotonically with initial length (panel A). In panel E, filled circles denote mechanical enthalpy change, open circles denote crossbridge enthalpy change. In panel F, filled circles denote mechanical efficiency, open circles denote crossbridge efficiency.