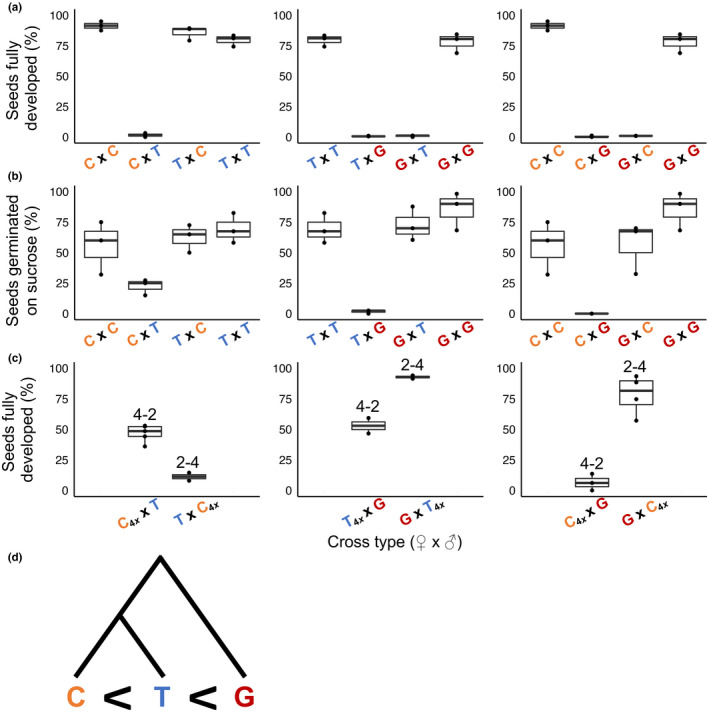
Fig. 1.

Seed viability of intra‐ and interspecific crosses among Mimulus caespitosa (C), Mimulus tilingii (T), and Mimulus guttatus (G). The first letter of each cross indicates the maternal species. The box and whisker plots span the distribution of all data points (shown as dots): the box contains the middle 50% of values, the whiskers represent the upper and lower 25% of values, and the horizontal line represents the median. (a) Percentage of seeds per fruit that appeared fully developed. (b) Percentage of a subset of seeds per fruit that germinated on a sucrose medium. (c) Percentage of seeds per fruit that appeared fully developed from interspecific interploidy crosses. The numbers above the box plots indicate interspecific crosses between different ploidy levels (‘4–2’, ‘2–4’) with the maternal parent's ploidy listed first. The ‘4x’ subscript denotes a synthetic tetraploid parent. (d) Simplified phylogenetic tree (modified from Sandstedt et al., 2021) with effective ploidy relationships among the three species: M. caespitosa is the lowest, M. tilingii is intermediate, and M. guttatus is the highest.
