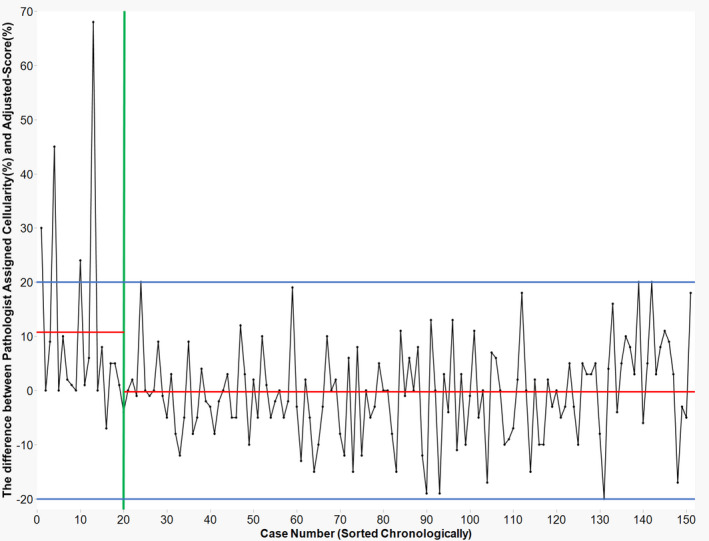
Figure 5.

Improvement of cellularity estimation. Chronological variation of deviation between adjusted‐score and path‐score for an individual pathologist. In the early stage, overestimation exceeding 20% deviation from adjusted‐score appeared in certain cases, but the path‐score stabilised. Although the pathologists supervised the artificial intelligence (AI), they could similarly learn from it. These data not only implied that the human‐in‐the‐loop workflow effectively improved the pathologist's assessment but also highlighted the requirement of AI aid (despite increased trials of cellularity estimates, the pathologist's score varied).Red lines: the average difference between individually assigned cellularity and adjusted‐score. Separate averages are shown for case numbers 1–19 (average = 10.95), and from 20 on (average = −0.598). Blue lines: ±20% is shown as a cut‐off range in percentage difference. Green line: case number 20.
