
FIGURE 2.
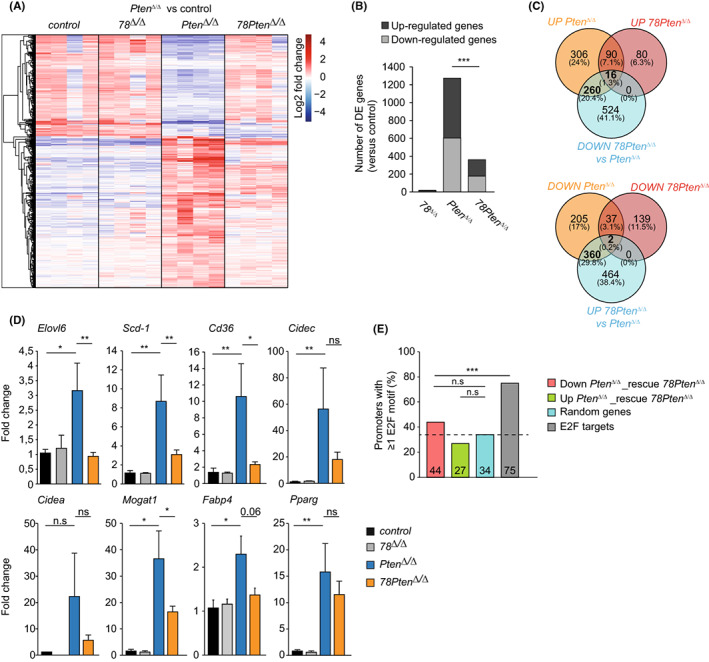
Polyploid hepatocytes promote lipid biosynthesis by enhancing PPAR gamma signalling. (A) Differential gene expression analysis of gene transcripts identified in RNA seq samples from the indicated genotypes (n = 4). Heatmap showing 2log‐fold change in expression of transcripts that were differentially expressed in Pten Δ/Δ compared to control livers. (B) Stack histogram showing the numbers of differentially expressed genes (up‐ or down‐regulated) in the indicated genotypes compared to control livers. ***p < .001 (chi‐square). (C) Venn diagram showing overlapping genes identified in RNAseq samples between the comparisons indicated. UP or DOWN comparisons are versus controls. (D) Transcript levels of PPARγ target gene expression in liver tissue of 16 weeks‐old mice. Fold changes were adjusted to average of controls and GAPDH and β‐Actin were used to normalize the expression. Data represent average ± SEM (n = 6 controls; n = 4 78 Δ/Δ, n = 9 Pten Δ/Δ , n = 8 78Pten Δ/Δ). **p < .05, **p < .01, ***p < .001; n.s non‐significant (Mann–Whitney rank sum test). (E) Histogram showing the overall percentage of promoters with at least 1 E2F consensus motif. ***p < .001; n.s non‐significant (Chi square).