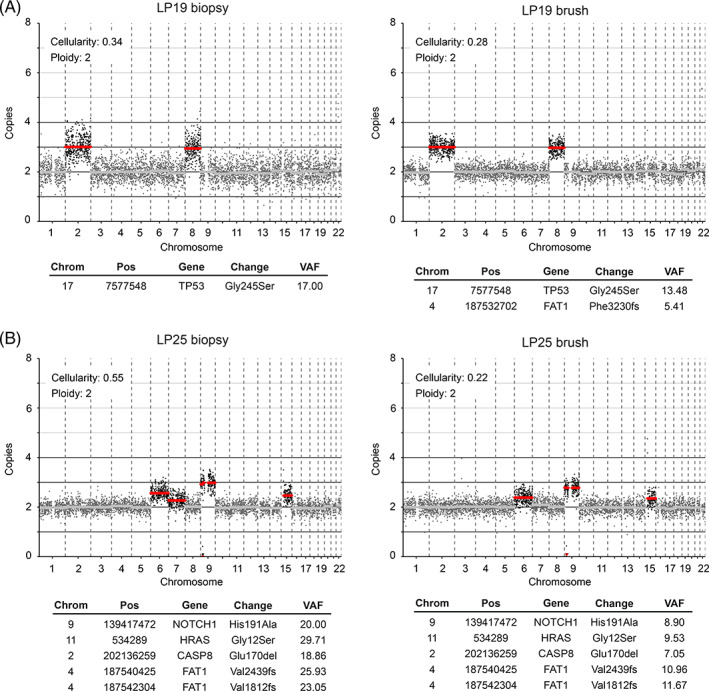
FIGURE 2.

Genetic analysis of two OL lesions. Lesions were analyzed for mutations and CNAs using biopsy material (left) and brushed cells (right). LP19 (A) represents a classic OL copy number profile with single copy gains of chromosome 2 and 8, and a mutation in a single copy of TP53, all of which appear clonal in both biopsy and brush. Brush data exhibits less noise than the corresponding biopsy, indicating superior DNA quality of the freshly frozen brush cells compared with FFPE tissue in case of the biopsy, which allowed us to detect the subclonal FAT1 frameshift variant. (B) LP25 reflects a burgeoning precancerous lesion. Mutations and CNAs are identical in biopsy and brush material of LP25. While mutations and CNAs on chromosome 9 appear clonal, CNAs on chromosomes 6, 7 and 15 are subclonal
