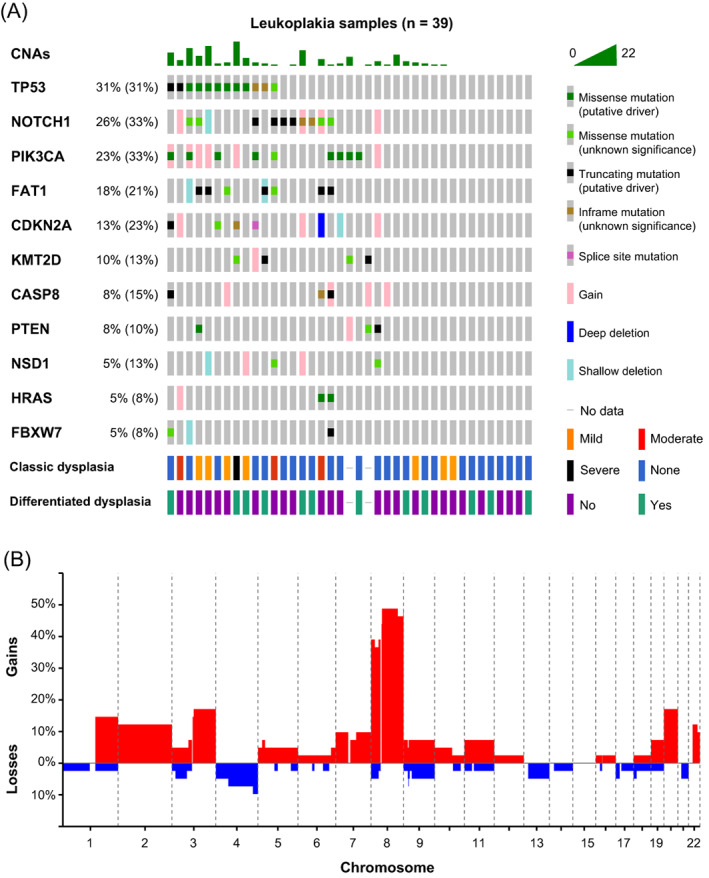
FIGURE 3.

Genetic characterization of OL samples. (A) Genetic data for 39 OL lesions in an oncoprint graph. Percentages of samples with alterations excluding single copy deletions and gains are given for the respective genes, with in parentheses percentages including deletions and gains. Gains but no amplifications were detected. Additionally, histopathological grading of dysplasia and differentiated dysplasia is shown. (B) Genome‐wide frequencies of copy number gains (red) and losses (blue) in 41 OL lesions. Genetic data were pooled from both brush and biopsy samples
