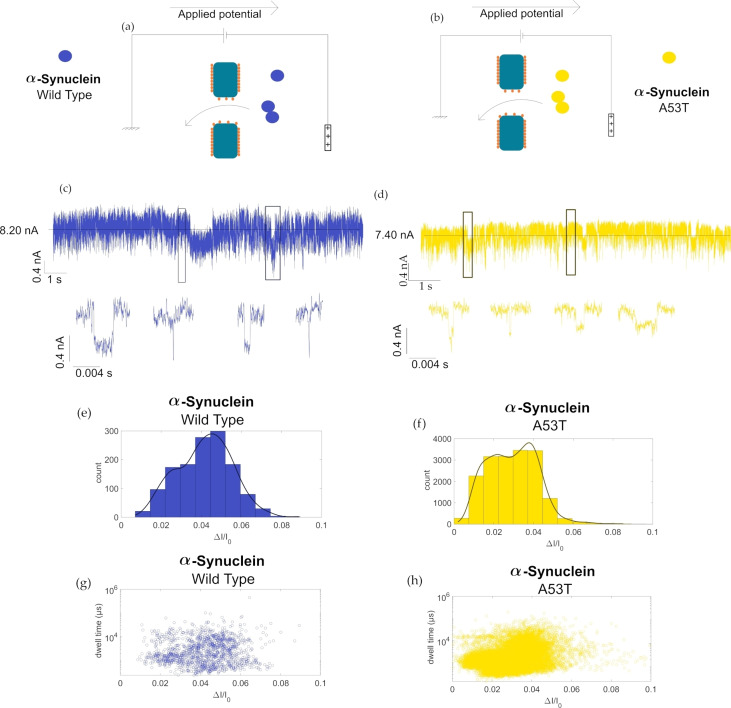
Figure 3.
Sketch of αS‐WT (a) and αS‐A53T (b) translocation through an L‐dopa coated SiN nanopores. 10 s of current trace recorded under +300 mV in 2 M NaCl PBS solution for (c) αS‐WT, and (d) αS‐A53T variants. Full current trace is 5 min long and generally have a baseline of 8.25 nA. The average current blockade of these events are then plotted in histogram (e) for the wild type and (f) for αS‐A53T. Scatter plots showing the dwell time in logarithmic scale vs average blockade showing the resulting scatter for (g) the αS‐WT and (h) αS‐A53T of the αS measurements.

