
Figure 6.
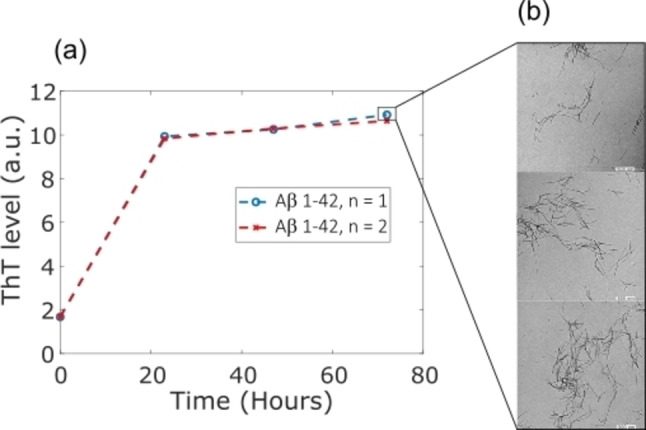
(a) ThT fluorescence intensity as a function of time showing the kinetics of Aβ aggregation and (b) the resulting fibril imaged by TEM microscopy at 80 kV.
Official websites use .gov
A
.gov website belongs to an official
government organization in the United States.
Secure .gov websites use HTTPS
A lock (
) or https:// means you've safely
connected to the .gov website. Share sensitive
information only on official, secure websites.
(a) ThT fluorescence intensity as a function of time showing the kinetics of Aβ aggregation and (b) the resulting fibril imaged by TEM microscopy at 80 kV.