
FIGURE 4.
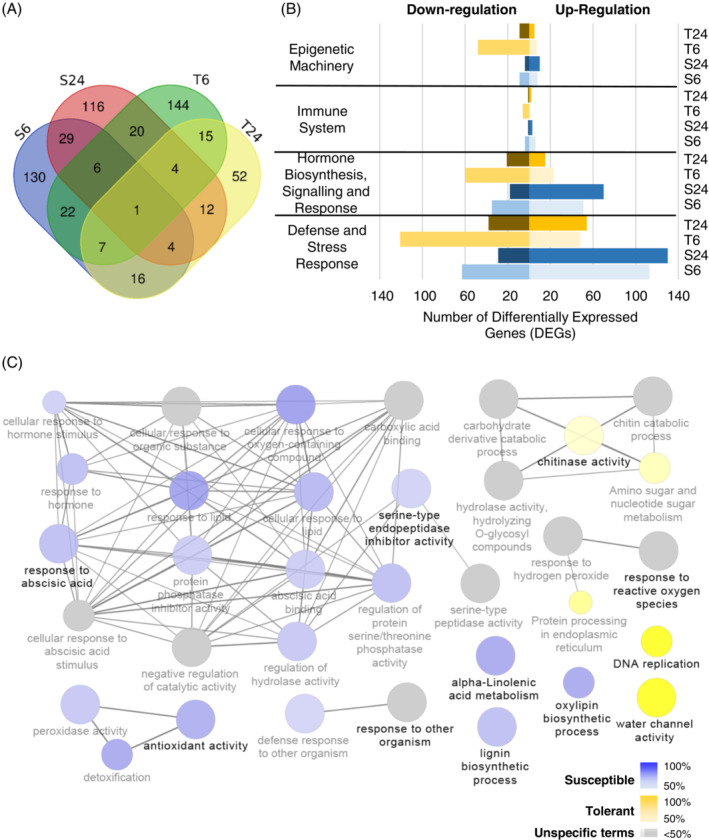
Defence response modulation after Plasmopara viticola inoculation. (A) Venn diagram showing the distribution of defence related differentially expressed genes (DR‐DEGs) at 6 and 24 h post inoculation (hpi) in susceptible (S—N20/020) and tolerant (T—N23/018) genotypes. Genes significantly modulated in the inoculated versus mock were considered as differentially expressed for each sample. (B) Histogram of the DR‐DEGs grouped by the most representative GO terms related to plant defence responses. Up‐ and Down‐regulation of inoculated versus mock is attributed by the rank product statistical method. T24: Tolerant at 24 hpi; T6: Tolerant at 6 hpi, S24: Susceptible at 24 hpi; S6: Susceptible at 6 hpi. (C) Cluster distribution network of DR‐DEGs showing most represented defence pathways when comparing susceptible (blue) versus tolerant genotypes (yellow). Gene network analysis was performed by Cytoscape plug‐in ClueGo. Only significant (p < 0.01) terms belonging to GO biological process, GO cellular components, GO molecular function and Kegg ontologies were shown. Gene proportion of each cluster is presented by colour gradient containing at least five genes on a GO interval from four to eight levels. Equal proportions of the two clusters are represented in grey. The node size is proportional to the term significance