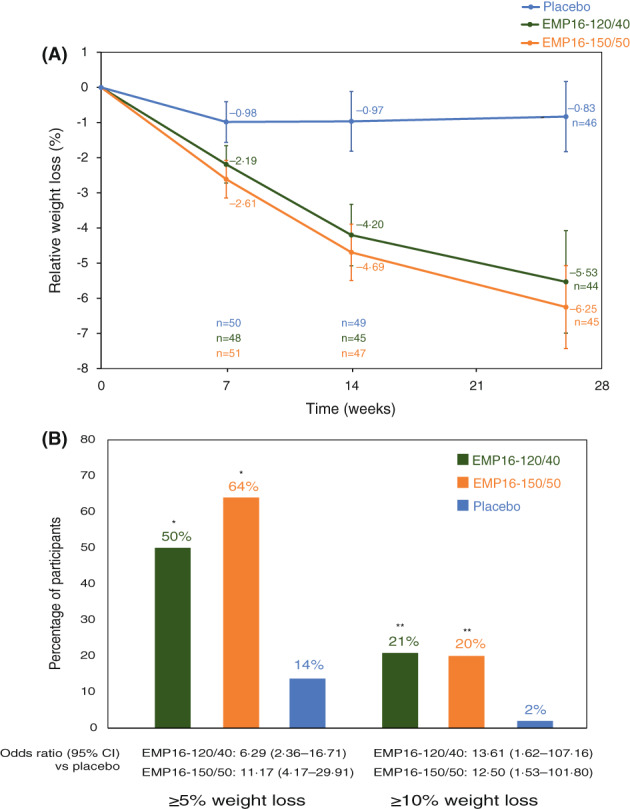
FIGURE 2.

Change in body weight. (A) Data are mean percent weight loss from baseline (95% CI) (ANCOVA estimate) for the intention‐to‐treat population with the last‐observation‐carried‐forward imputation. (B) Percentage of individuals who lost more than 5% and more than 10% of baseline weight at week 26 (intention‐to‐treat population with the last‐observation‐carried‐forward imputation). *p < 0.0001 vs. placebo. **p ≤ 0.001 vs. placebo [Color figure can be viewed at wileyonlinelibrary.com]
