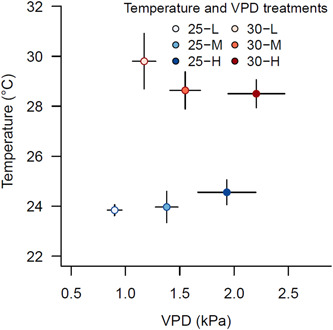
Figure 1.

Average temperature and vapour pressure deficit (VPD) in the six climate chambers. Plants were exposed to two temperature treatments (25°C and 30°C) and three VPD levels that are defined by low (L), middle (M) and high (H) VPD. Symbols indicate the average (±SD) over the total treatment period (June 1st – November 8th, 2020). [Color figure can be viewed at wileyonlinelibrary.com]
