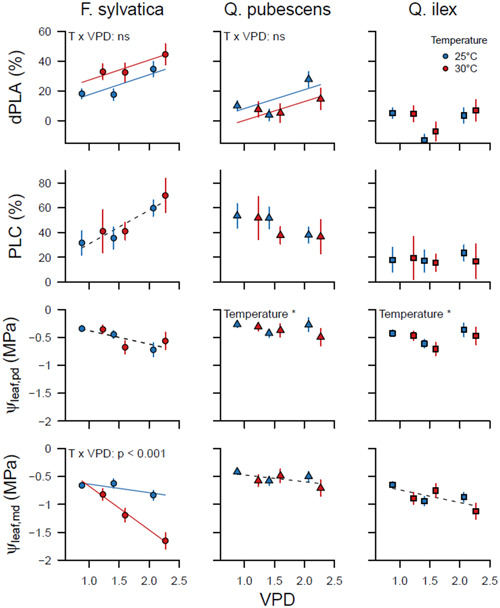
Figure 4.

Percentage loss of conductive area, calculated as the change in percent loss of conductive area (PLA) from the start of the experiment (dPLA, %total 2dembolized−%embolized at campaign 1), percentage loss of conductivity (PLC) and predawn and midday leaf water potential (ψ leaf, pd & ψ leaf, md) in Fagus sylvatica, Quercus pubescens and Quercus ilex in the two temperature and three vapour pressure deficit (VPD) treatments. Data are shown in relation to the average VPD in the chambers during the treatment period. Symbols indicate the mean ± SE of the three measurement campaigns (n = 18), except for PLC which was measured once at the end of the experiment (n = 6). Dashed lines indicate significant VPD effects without temperature effects. Coloured lines—blue for 25°C and red for 30°C—indicate an additive (T x VPD: ns) or interacting (T x VPD: p < 0.05) temperature effect in addition to VPD. [Color figure can be viewed at wileyonlinelibrary.com]
