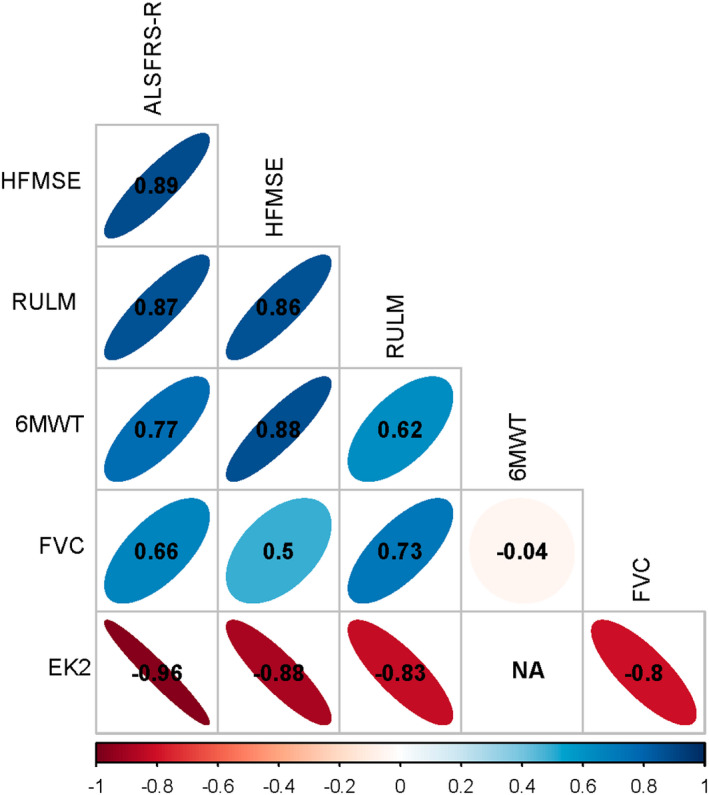
FIGURE 1.

Graphical representation of correlations between outcome measures. Colours represent the strength of correlations and numbers correspond to Spearman's rho correlations. 6MWT, 6‐Minute Walk Test; EK2, Egen Klassifikation 2; FVC, forced vital capacity; HFMSE, Hammersmith Functional Motor Scale Expanded; RULM, Revised Upper Limb Module. [Colour figure can be viewed at wileyonlinelibrary.com
