
Figure 5.
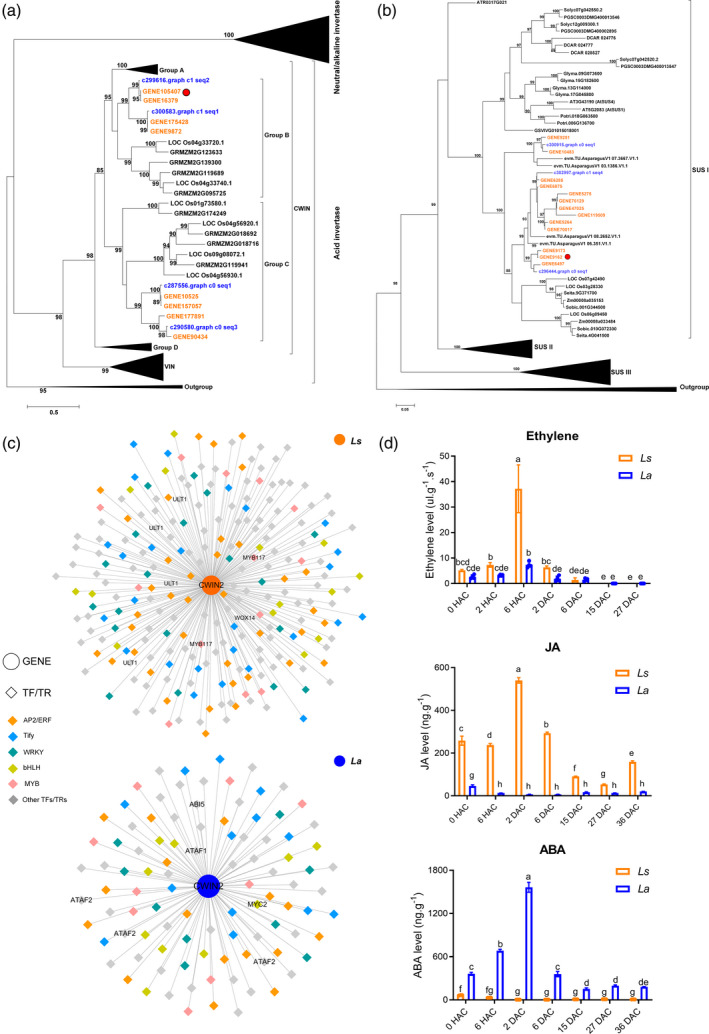
Comparative analysis regarding sucrose cleavage pathways during vegetative propagation (VP) in bulbs of Lycoris.
Phylogenetic analyses of invertase (a) and sucrose synthases (b) in Lycoris and 12 and 13 representative plants, respectively. Font colors of orange and blue indicate the Lycoris transcripts from Pacbio and Illumina platform, respectively.
(c) Networks built from correlations among CWIN2 and transcription factors (TFs)/transcription regulators (TRs) in Ls and La, respectively. Pearson correlation coefficient values were calculated for each pair of genes, and r ≥ 0.9 (P ≤ 0.05) was used to filter the TFs/TRs that were significantly correlated with each gene.
(d) Changes of stress response hormone levels during VP in both Lycoris species. Different letters indicate significant difference at P < 0.05 according to Duncan's multiple range test. [Colour figure can be viewed at wileyonlinelibrary.com]