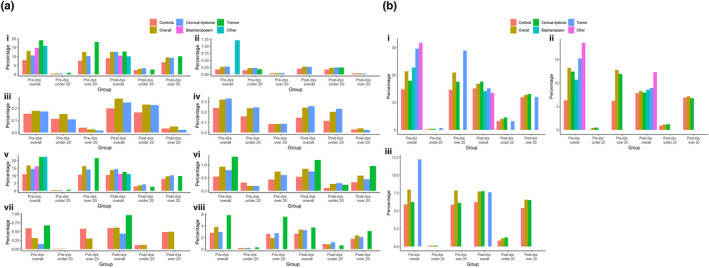
FIGURE 2.

(a) Proportions of diagnoses by age and time for cases and controls: i, anxiety disorder; ii, attention‐deficit/hyperactivity disorder; iii, autism spectrum disorder; iv, conduct disorder; v, depression; vi, eating disorder; vii, severe mental illness; and viii, substance use disorder. (b) Proportions of prescriptions by age and time for cases and controls: i, antidepressants; ii, anxiolytics; and iii, hypnotics. Percentages can be >100% where participants had more than one diagnosis. dys, dystonia diagnosis [Colour figure can be viewed at wileyonlinelibrary.com
