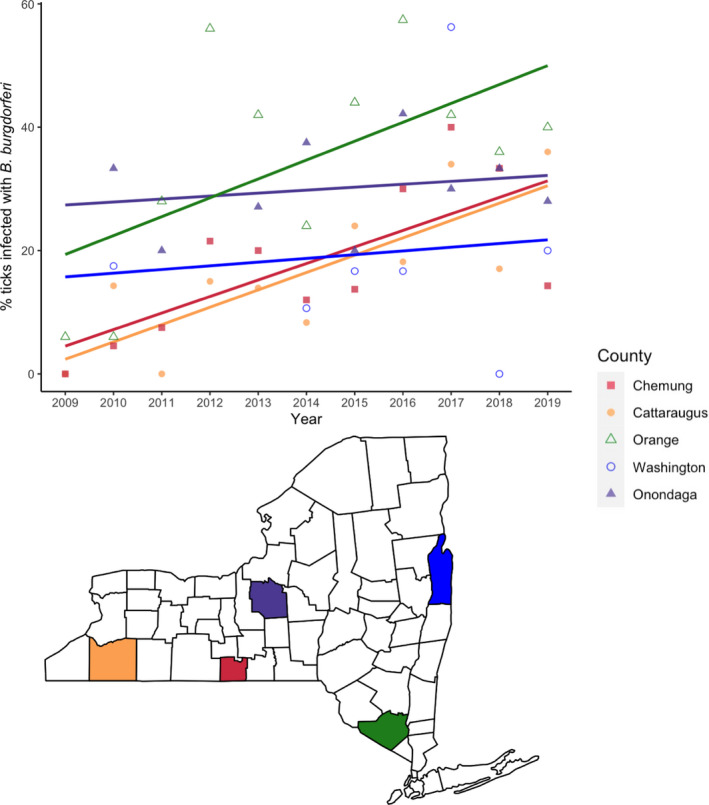
FIGURE 1.

The prevalence of Borrelia burgdorferi‐infected nymphs increased non‐uniformly across NYS between 2009 and 2019. Five representative collection sites from different counties (each depicted by a unique colour and shape) illustrate the disparate temporal patterns of NIP among sites. NIP increased in these sites over the decade in which collections were made, but at different rates based on the slope of best‐fit line. Sites with initially low NIP increased at the fastest rates (south‐central and western NYS). In contrast, NIP generally increased at moderate rates in regions with established pathogen populations. These representative sites were sampled almost every year of the study period and thus capture pathogen population dynamics at each site most accurately. Points represent the observed annual median infection rate for each site.
